
A Plant-Level Method for Turning Reagent Efficiency Into Margin
A rising gold price hides a lot of operational drift. The reagent line is one of the few costs a plant can measure and move.
AngloGold Ashanti's Q3 2026 update gives a clear read on gold mining economics at current prices: average realised price US$4,239/oz against US$3,490/oz a year earlier, and all-in sustaining cost US$2,170/oz against US$1,720/oz. Prices rose faster than costs, but royalties, fuel and capital intensity all climbed. For a plant operator, the useful response is not a macro view — it is a method that converts reagent efficiency into a cost-per-ounce figure that can be compared with the AISC line.
Βασικά Συμπεράσματα
- Realised price rose 21% year on year to US$4,239/oz from US$3,490/oz.
- AISC rose too: US$2,170/oz against US$1,720/oz, driven by price-linked royalties, fuel and capital intensity.
- Production fell to 696,000 oz from 768,000 oz, so cost per ounce absorbed fixed cost over fewer ounces.
- Free cash flow fell to US$722 million from US$920 million as capital expenditure climbed to US$563 million from US$388 million.
- Reagent efficiency is measurable. Side reactions, over-dosing and Άνθρακας fines are three loss channels that can be quantified in kg/t and converted to cost per ounce.
- Do not let price mask drift. A high gold price makes a rising consumption trend easy to ignore until the cycle turns.
| Μετρικός | Q3 2026 | Q3 2025 |
|---|---|---|
| Realised gold price | US$4,239/oz | US$3,490/oz |
| AISC | US$2,170/oz | US$1,720/oz |
| EBITDA | 1,568 εκατομμύρια δολάρια ΗΠΑ | 1,400 εκατομμύρια δολάρια ΗΠΑ |
| Παραγωγή | 696,000 ουγκιά | 768,000 ουγκιά |
| Δωρεάν ταμειακές ροές | 722 εκατομμύρια δολάρια ΗΠΑ | 920 εκατομμύρια δολάρια ΗΠΑ |
| Κεφαλαιουχικές δαπάνες | 563 εκατομμύρια δολάρια ΗΠΑ | 388 εκατομμύρια δολάρια ΗΠΑ |
Price-linked royalties added to unit costs over the period. Source: company Q3 2026 update, 5 November 2026. All figures above are disclosed company numbers; no plant cost figures have been estimated by the publisher.
1. Why a rising price is a poor excuse for drifting consumption
When realised price rises 21% year on year, a plant can absorb a meaningful increase in unit cost and still report a healthy margin. That is precisely the condition in which operational discipline slips: over-dosing becomes invisible, carbon make-up is written off as routine, and a rising reagent spend per tonne is attributed to ore rather than measured.
The Q3 2026 numbers show why that is risky. AISC rose US$450/oz while production fell from 768,000 oz to 696,000 oz, so fixed cost was spread over fewer ounces. Free cash flow fell even as EBITDA rose, because capital expenditure climbed from US$388 million to US$563 million. Price-linked royalties, fuel and capital intensity are largely outside a plant metallurgist's control; reagent efficiency is not.
2. Three reagent loss channels worth quantifying
2.1 Side reactions and impurity demand
Excess NaOH and Na₂CO₃, copper and arsenic minerals and high insolubles all consume reagent without dissolving gold. A high-purity NaCN briquette with low insolubles narrows that loss, and the batch COA is the reference for measuring it.
2.2 Over-dosing after the dissolution plateau
A flat continuous feed wastes reagent in the final hours of a leach, when the dissolution curve has flattened. A front-loaded, tapered dosing profile built from a bottle roll curve removes that spend without changing recovery.
2.3 Carbon fines carrying loaded gold
Fines generated above the ≤1.5% attrition design limit leave the circuit already loaded. The loss shows up as a gap between dissolved and recovered gold, not as a reagent invoice — which is why it is usually underestimated.
3. Tutorial: six steps from reagent efficiency to margin per ounce
- Establish a cost-per-tonne baseline. From plant logs, compute reagent spend per tonne of ore treated for a defined period, broken down by leaching reagent and carbon make-up.
- Decompose the three loss channels. Estimate the kg/t attributable to side reactions, to over-dosing after plateau, and to carbon fines carrying gold. Use measured titration and carbon inventory data, not assumptions.
- Compute the recoverable saving per tonne. Apply your own delivered reagent cost to the avoidable kg/t. Keep this separate from the gold value of recovered fines.
- Convert to cost per ounce. Divide the saving per tonne by recovered grade times metallurgical recovery to express it in currency per ounce, on the same basis as AISC.
- Compare with the AISC movement. Set the result against the US$450/oz year-on-year AISC increase. This tells you what share of cost pressure is addressable inside the circuit.
- Lock the gains with documentation. Batch COA, TDS and MSDS per lot, a fixed dosing profile, a defined free-κυανιούχο or residual-reagent titration routine, and a carbon attrition target at ≤1.5%.
The method uses your own measured inputs. Published market figures set the context; they are not substitutes for plant data.
4. Πίνακας αντιμετώπισης προβλημάτων
| Σύμπτωμα | Πιθανή αιτία | Πρώτος έλεγχος |
|---|---|---|
| Reagent spend per tonne rising | Side reactions or flat dosing profile | COA impurity figures, titration log, dissolution curve |
| High residual reagent in tails | Dosing continues after plateau | Addition profile, titration frequency |
| Dissolved versus recovered gold gap | Loaded carbon fines leaving circuit | Attrition against ≤1.5%, tails assay, screen aperture |
| Cost per ounce worse with fewer ounces | Fixed cost over lower production | Throughput, grade, recovery |
| Deviation cannot be attributed | Lot not linked to plant log | COA filing, sampling routine |
5. Where the three products act on the cost line
| Loss channel | Προϊόν | Έλεγχος |
|---|---|---|
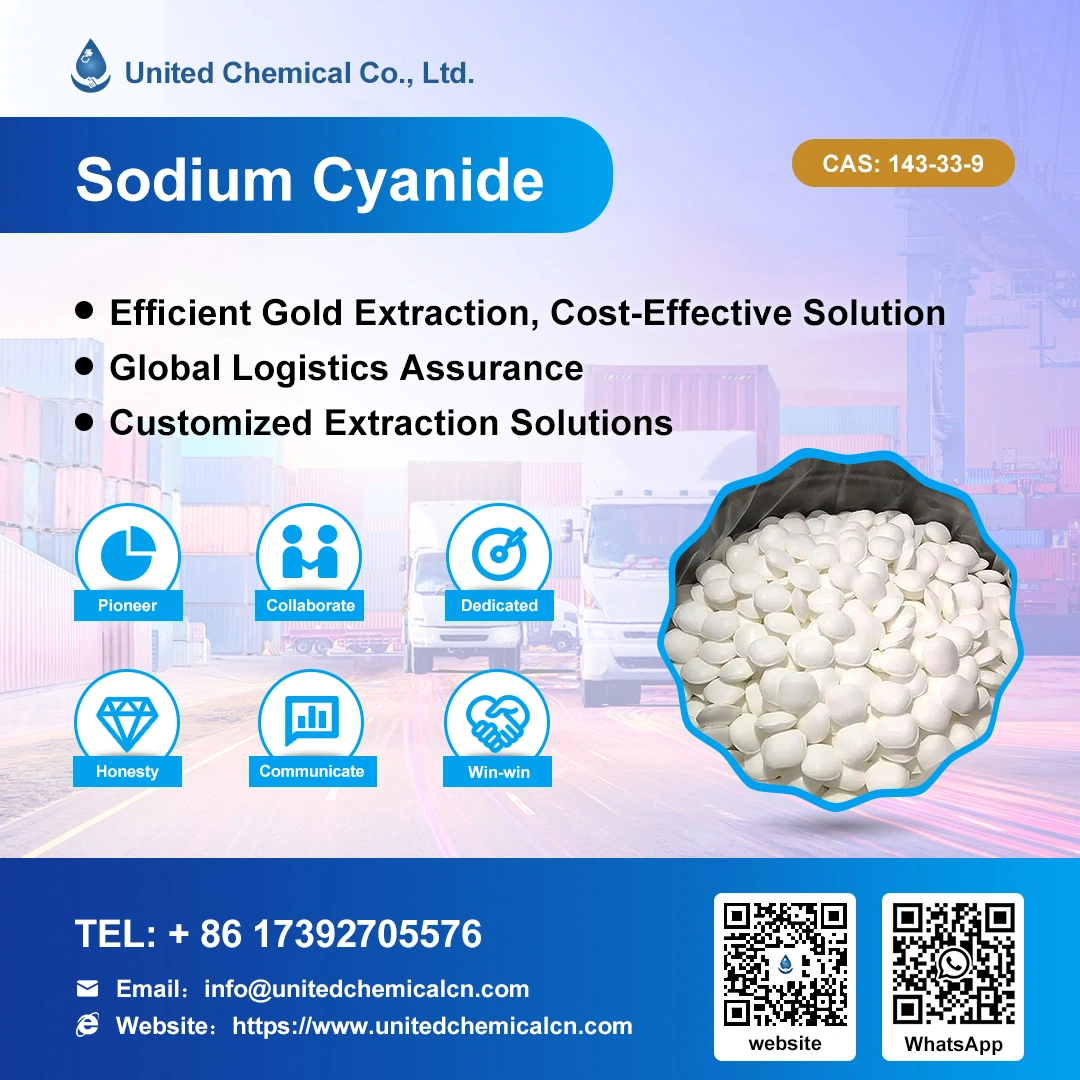
| Impurity-driven side reactions | Κυανιούχο νάτριο AuCyan™ NaCN (≥98.3%) | Low NaOH / Na₂CO₃ / insolubles; batch COA |
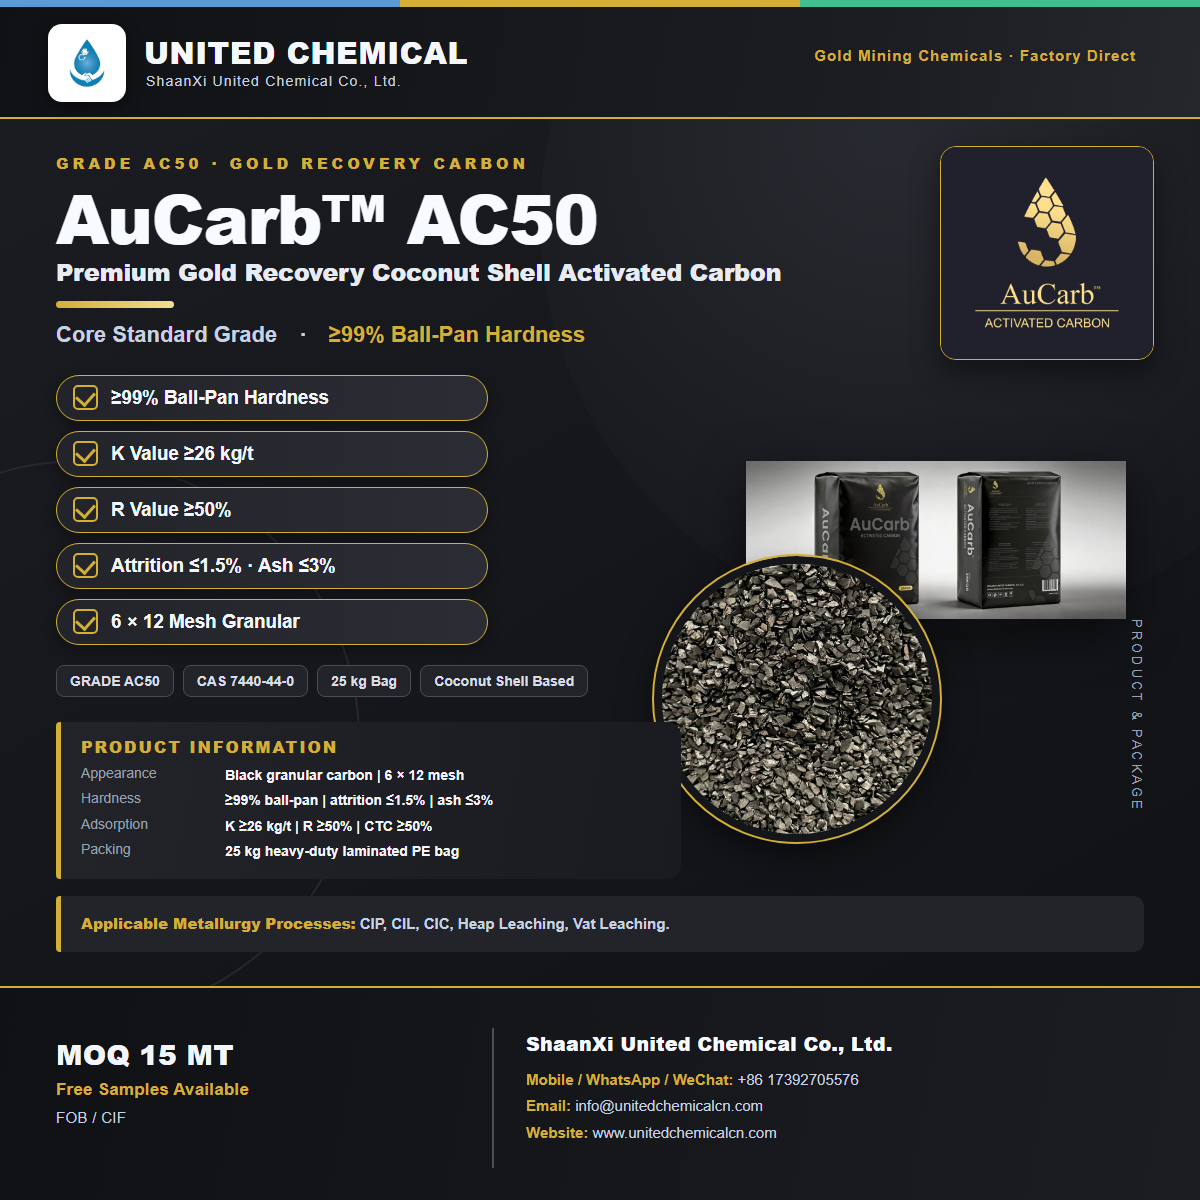
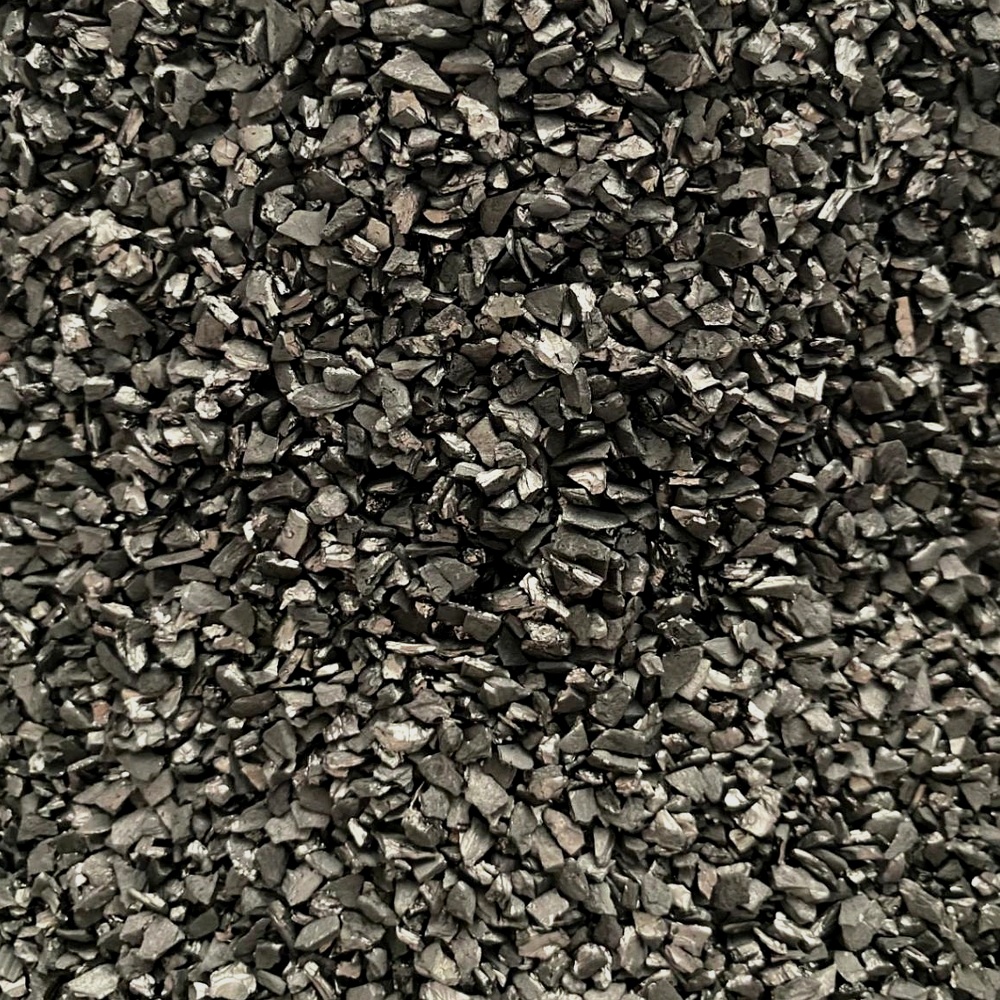
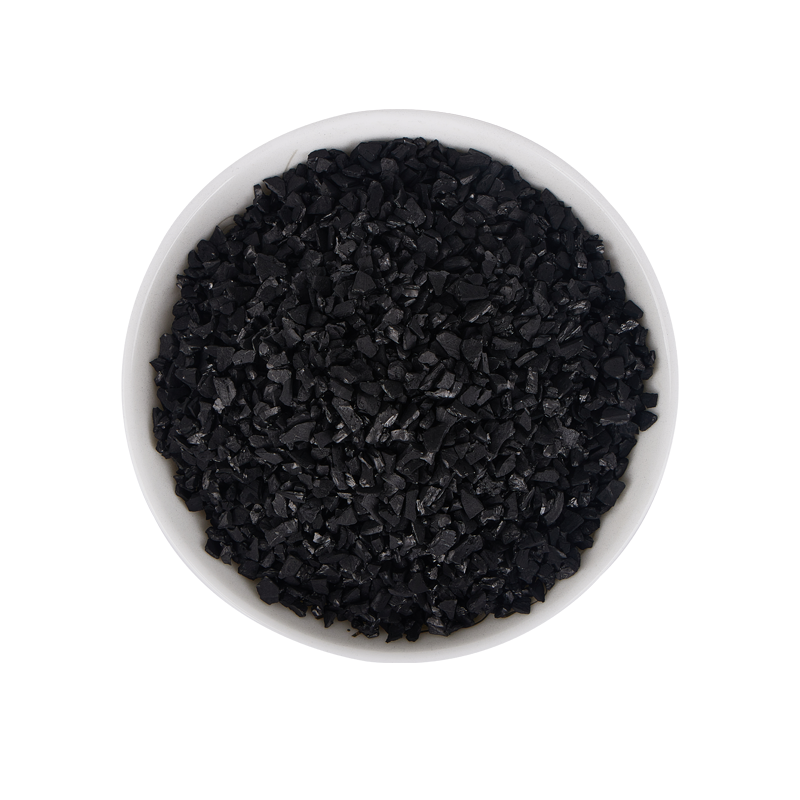
| Loaded-gold loss to fines | Ενεργός Άνθρακας με Κέλυφος Καρύδας AuCarb™ Gold Recovery (Σκληρότητα ≥99%) | Attrition ≤1.5%, 6×12 mesh, platelet ≤5.0% |
| Permit-driven schedule cost | Παράγοντας έκπλυσης χρυσού AuLeach™ (GDA) – Μη επικίνδυνο | General-cargo route, pH 10.5–12 validation |
United Chemical supplies all three factory-direct under FOB or CIF terms with batch COA, TDS and MSDS, serving mining operations in more than 77 countries at 15 / 18 / 28 MT minimum order quantities per 1×20' FCL.
6. Συχνές Ερωτήσεις
Q1. What was the Q3 2026 realised gold price?
US$4,239/oz, up from US$3,490/oz a year earlier — a 21% increase.
Q2. What was the Q3 2026 AISC?
US$2,170/oz against US$1,720/oz in Q3 2025.
Q3. Did production rise with the price?
No. Production was 696,000 oz against 768,000 oz a year earlier, so fixed cost was spread over fewer ounces.
Q4. Why did free cash flow fall while EBITDA rose?
Capital expenditure climbed to US$563 million from US$388 million, taking free cash flow to US$722 million from US$920 million.
Q5. Which cost drivers are outside plant control?
Price-linked royalties, fuel and capital intensity. Reagent efficiency is one of the few variables a plant team can measure and move.
Q6. What are the three reagent loss channels?
Impurity-driven side reactions, over-dosing after the dissolution plateau, and carbon fines carrying loaded gold.
Q7. How do you express a reagent saving on the same basis as AISC?
Compute the avoiding cost per tonne of ore, then divide by recovered grade times metallurgical recovery to get a currency-per-ounce figure.
Q8. Which product controls impurity-driven side reactions?
AuCyan™ Sodium Cyanide NaCN (≥98.3%), with controlled NaOH, Na₂CO₃ and ultra-low insolubles verified against the batch COA.
Q9. Which carbon parameter limits gold loss to fines?
Attrition ≤1.5% on AC50, together with ≥99% hardness, a 6×12 mesh cut and platelet ≤5.0%.
Ε10. Ποιοι Incoterms ισχύουν;
Ισχύουν όροι FOB ή CIF.
Q11. Can published market figures replace plant data in the calculation?
No. Grade, recovery, kg/t consumption and delivered reagent cost must come from plant logs; market figures only set the context.
Ε12. Πού μπορούν να εξεταστούν οι προδιαγραφές;
Στις τεχνικές σελίδες AuCyan™, AuCarb™ και AuLeach™ που συνδέονται παρακάτω, με πιστοποιητικό αυθεντικότητας παρτίδας, φυλλάδια υλικού (TDS) και MSDS ανά παρτίδα.
7. Πηγές και εσωτερικοί σύνδεσμοι
AuCyan™ · Οδηγός AuCarb™ · AC50 · AC55 · AC60 · BC1100 · AuLeach™ GDA · Χρυσό Τρίγωνο · Επισκόπηση τριών προϊόντων · Συχνές ερωτήσεις για χημικά · Νέα του κλάδου · Επικοινωνήστε μαζί μας
Source note: company figures are drawn from the Q3 2026 update dated 5 November 2026. Reagent specifications are United Chemical product data. The calculation is a method using plant-supplied inputs.
Επικοινωνήστε μαζί μας · WhatsApp +86 173 9270 5576 · info@unitedchemicalcn.com
- Τυχαίο περιεχόμενο
- Καυτό περιεχόμενο
- Καυτό περιεχόμενο κριτικής
- Ευέλικτος Ειδικός Σχέσεων Πελατών και Προμηθευτών (Τοποθεσία: Ινδία)
- Ηλεκτρικός πυροκροτητής Magneto (Αντιστρεπτικό ρεύμα)
- ακρυλαμιδίου
- Γλυκονικό νάτριο για επεξεργασία νερού
- United Chemical, TuXingSun Mining και Henan Lingbao Gold Mine ιδρύουν από κοινού ένα ορυχείο χωρίς κυάνιο
- Πλοήγηση στην αλλαγή: Η μελλοντική κατεύθυνση της χημικής βιομηχανίας
- Ποια χημική ουσία είναι η πιο διαβρωτική;
- 1Κυανιούχο νάτριο με έκπτωση (CAS: 143-33-9) για εξόρυξη - Υψηλή ποιότητα και ανταγωνιστικές τιμές
- 2Κυανιούχο νάτριο 98.3% CAS 143-33-9 NaCN χρυσός επιδέσμου απαραίτητος για τις χημικές βιομηχανίες εξόρυξης
- 3Νέοι κανονισμοί της Κίνας για τις εξαγωγές κυανιούχου νατρίου και καθοδήγηση για διεθνείς αγοραστές
- 4Κυανιούχο νάτριο (CAS: 143-33-9) Πιστοποιητικό τελικού χρήστη (Κινεζική και Αγγλική έκδοση)
- 5Διεθνής Κώδικας Διαχείρισης Κυανιούχου (Κυανιούχου Νατρίου) - Πρότυπα Αποδοχής Χρυσωρυχείου
- 6Εργοστάσιο Κίνας Θειικό Οξύ 98%
- 7Άνυδρο Οξαλικό οξύ 99.6% Βιομηχανικής Ποιότητας
- 1Κυανιούχο νάτριο 98.3% CAS 143-33-9 NaCN χρυσός επιδέσμου απαραίτητος για τις χημικές βιομηχανίες εξόρυξης
- 2Υψηλή καθαρότητα · Σταθερή απόδοση · Υψηλότερη ανάκτηση — κυανιούχο νάτριο για σύγχρονη έκπλυση χρυσού
- 3United ChemicalΗ ερευνητική ομάδα του ’s επιδεικνύει εξουσία μέσω πληροφοριών που βασίζονται σε δεδομένα
- 4Κυανιούχο νάτριο υψηλής απόδοσης AuCyan™ | Καθαρότητα 98.3% για παγκόσμια εξόρυξη χρυσού
- 5Ψηφιακός ηλεκτρονικός πυροκροτητής (Χρόνος καθυστέρησης 0~ 16000ms)
- 6Πυροκροτητής σωλήνων κρούσης υψηλής αντοχής, υψηλής ακρίβειας
- 7βιομηχανία Ηλεκτρικός Πυροκροτητής



Ηλεκτρονική διαβούλευση μηνυμάτων
Πρόσθεσε σχόλιο: