
Geita to 600,000 oz/y by 2030: A Worked Calculation of Carbon and Reagent Consumption
The expansion raises throughput on an existing footprint. That makes karbon circulation and reagent consistency the variables that move.
AngloGold Ashanti has allocated US$480–580 million to expand the Geita gold mine in Tanzania, targeting annual production of about 600,000 ounces by 2030 against 492,000 ounces in 2025. It is the largest single item in the company's US$750–900 million brownfield programme announced on 5 November 2026. Q3 2026 output was 120,000 ounces, 4% lower year on year, as mined grades declined. Because the circuit already exists, the planning task is to convert an ounce increment into ore tonnage, reagent kilograms and container counts — using the plant's own measured inputs.
Takeaways Key
- Existing footprint, higher throughput. The expansion does not replace the leaching and adsorption circuits; it loads them more heavily.
- Grade decline is the multiplier. Q3 2026 output fell 4% year on year as mined grades declined, so more tonnes are needed per ounce.
- Carbon circulation rises with throughput. Higher screening duty makes attrition ≤1.5% and a 6×12 mesh cut directly relevant to recovery.
- Calculate with your own inputs. Grade, recovery, kg/t consumption and carbon make-up must come from plant logs or a test programme — not from a headline figure.
- MOQs set the container rhythm: 15 MT for AuCarb™, 18 MT for AuCyan™, 28 MT for AuLeach™ per 1×20' FCL.
- Documentation precedes production. di mana Natrium Sianida is used, permits and an End-User Certificate gate the factory slot.
| barang | Angka anu diungkabkeun |
|---|---|
| Allocation to Geita | US$480–580 juta |
| Target production | ~600,000 oz/y by 2030 |
| Basis 2025 | 492,000 oz |
| Q3 2026 output | 120,000 oz, 4% lower year on year |
| Programme context | Largest item in a US$750–900m brownfield programme |
Source: company Q3 2026 update and expansion announcement, 5 November 2026. The calculation below is a method; all inputs are plant-specific and are not estimated by the publisher.
1. Why this is a consumables question
A brownfield expansion inherits the flowsheet. Tanks, agitation, screens, pumps, carbon advance systems and the water balance are already designed and commissioned. The additional ounces have to pass through that installed equipment, typically by raising throughput, improving grade control or extending operating hours. Reagent demand therefore scales with treated tonnage rather than with the capital budget.
There is a second effect. When mined grade declines, the same ounce target requires more ore. Geita's Q3 2026 output of 120,000 oz, down 4% year on year as grades declined, is exactly that pattern. It means reagent consumption per ounce rises even if consumption per tonne of ore is unchanged — a distinction that matters when the margin is under pressure from a higher AISC.
2. Four difficulties in a brownfield consumables plan
2.1 Grade uncertainty across the ramp
A single grade assumption hides the two ends of the plan. Model at least a base and a lower-grade case, because the lower-grade case drives the highest tonnage and reagent demand.
2.2 Carbon inventory and screening duty
More throughput means more carbon movement and more screening cycles. Fines generated above the ≤1.5% attrition design limit leave the circuit loaded with gold, so the loss is a recovery gap rather than a visible consumable expense.
2.3 Water balance and reagent build-up
Recirculated process water concentrates dissolved salts and residual reagent over a longer campaign. Without routine measurement, apparent consumption drifts and operators compensate by over-dosing.
2.4 Multi-site documentation
di mana natrium sianida is used, the UN 1689 Class 6.1 permit chain and the End-User Certificate must be closed before production is scheduled, and dangerous-goods booking has to be sequenced to the ramp, not to the nameplate date.
3. Tutorial: a seven-step worked calculation
The steps below are deliberately written as formulas. Insert your own measured inputs; do not substitute published headline numbers for plant data.
- Define the ounce increment. ΔOz = target annual ounces − base-year ounces. Use the disclosed 600,000 oz/y target and 492,000 oz 2025 base as the boundary, then state the ramp year you are solving for.
- Convert ounces to treated ore. ΔT = ΔOz ÷ (recovered grade × metallurgical recovery). State both grade and recovery as measured plant values, and run a lower-grade case.
- Apply leaching reagent consumption. Reagent kg = ΔT × measured kg/t from plant logs or a bottle roll programme. Keep the figure tied to a specific ore blend.
- Apply carbon make-up. Carbon kg = ΔT × measured carbon make-up rate (kg/t), cross-checked against the ≤1.5% attrition design figure and the plant's carbon inventory survey.
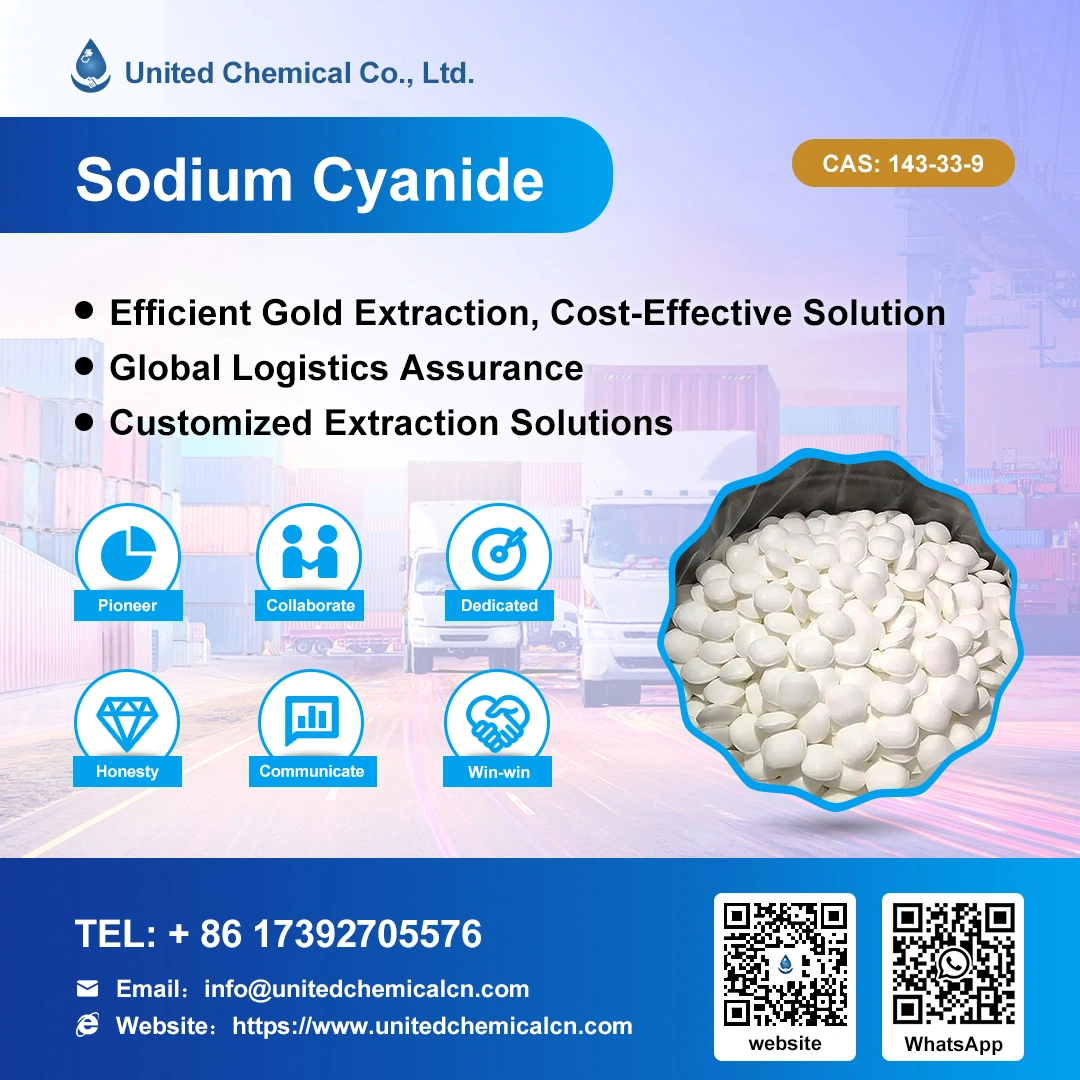
- Convert to FCL counts. Divide each reagent tonnage by its MOQ — 18 MT for AuCyan™ Sodium Cyanide NaCN (≥98.3%), 15 MT for AuCarb™ Gold Recovery Coconut Shell Activated Carbon (≥99% Hardness), 28 MT for AuLeach™ Gold Leaching Agent (GDA) – Non-Hazardous — and round up to whole containers.
- Jieun kalénder pangiriman against the ramp curve, then place the documentation gate (permit, EUC, dangerous-goods booking) ahead of the first production slot.
- Close the measurement loop. Log consumption, pH, free sianida or residual reagent, dissolved gold and recovery against each batch COA; update step 3 and step 4 inputs as the ore blend changes.
A useful sanity check: if step 2 tonnage rises but step 5 container count does not, the MOQ rounding is hiding a step change. Always show the unrounded figure next to the container count.
4. Tabel pangungkulan masalah
| ciri | Kamungkinan ngabalukarkeun | Pariksa heula |
|---|---|---|
| Consumption per ounce rising | Grade decline, more tonnes per ounce | Recovered grade, recovery, ΔT calculation |
| Carbon make-up above design | Higher screening duty, attrition above ≤1.5% | Fines in tails, screen aperture, circulation rate |
| Apparent consumption drifting | Réagen sésa dina cai anu disirkulasi ulang | Solution balance, water quality, titration routine |
| Gold in final-stage solution | Adsorption rate-limited at higher throughput | Carbon concentration, residence time, R value |
| Shipment late against ramp | Documentation gate not sequenced | Permit status, EUC, dangerous-goods booking |
5. Three products in the expanded circuit
| Panggung | barang | Variabel sénsitip kana ékspansi |
|---|---|---|
| Disolusi | Natrium Sianida AuCyan™ NaCN (≥98.3%) | kg/t at higher tonnage, free-cyanide control |
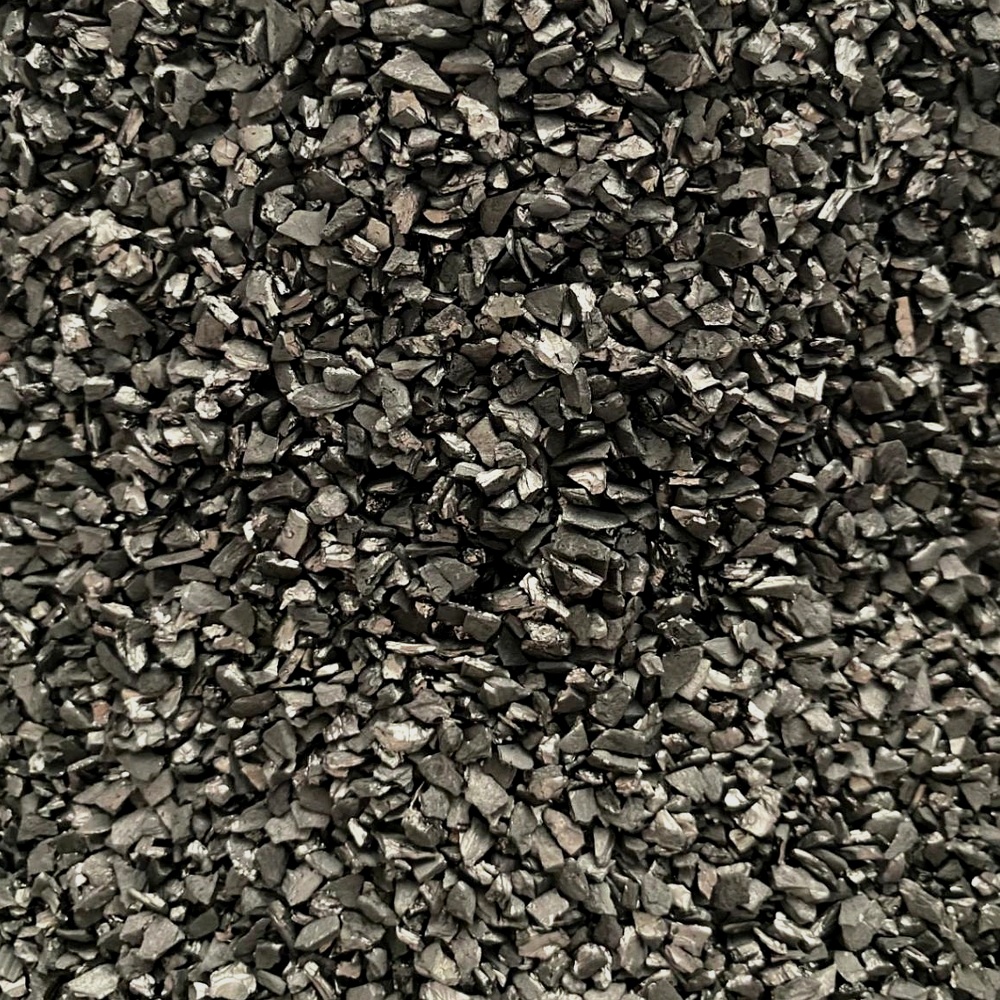
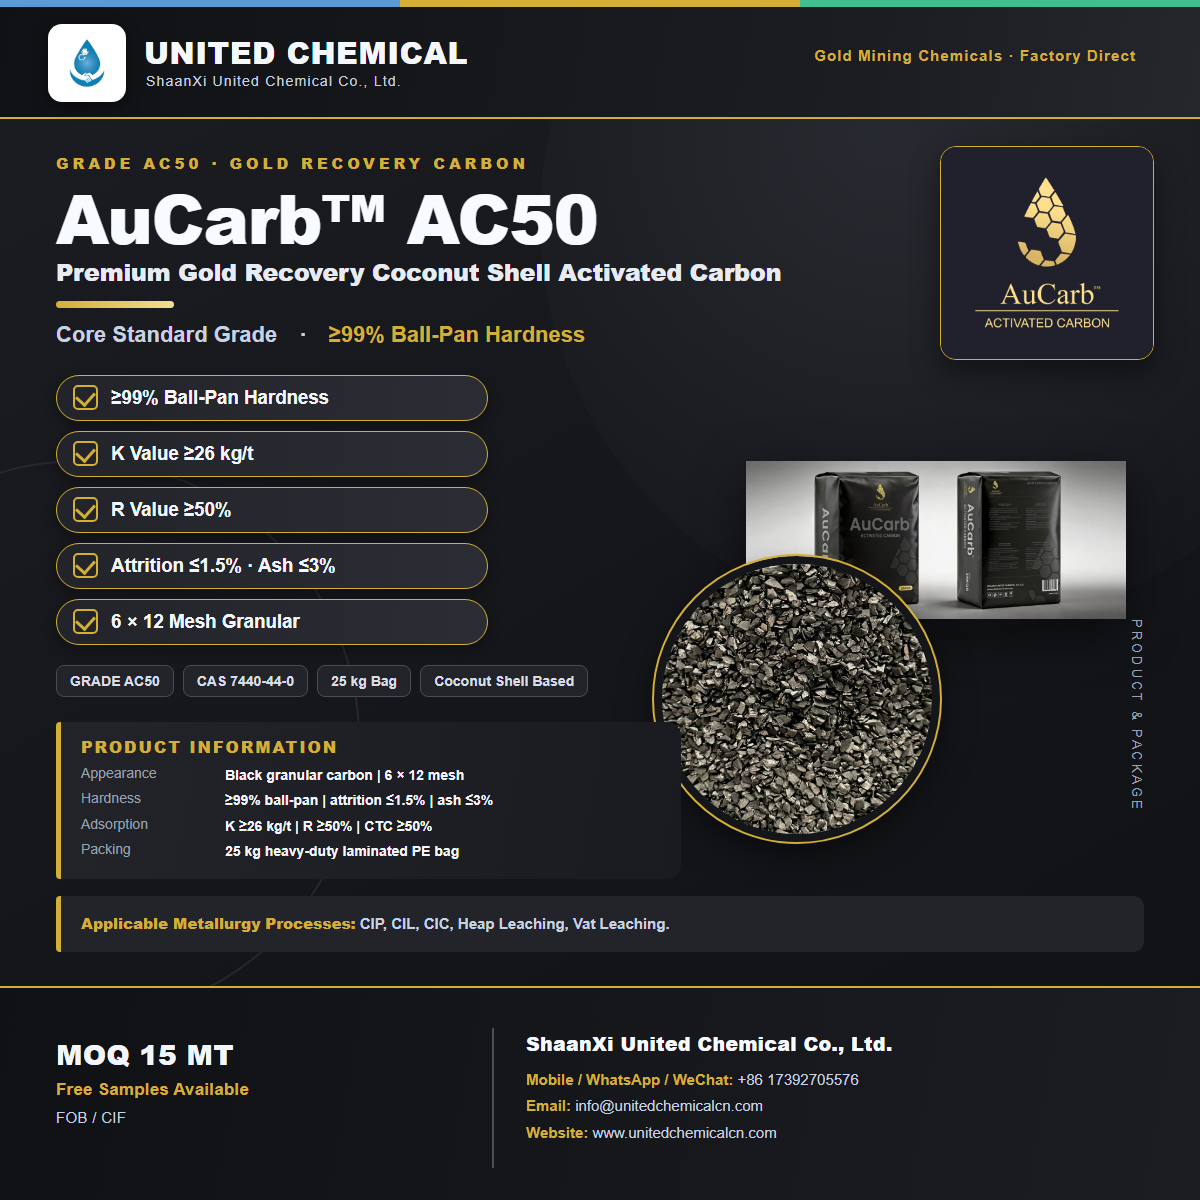
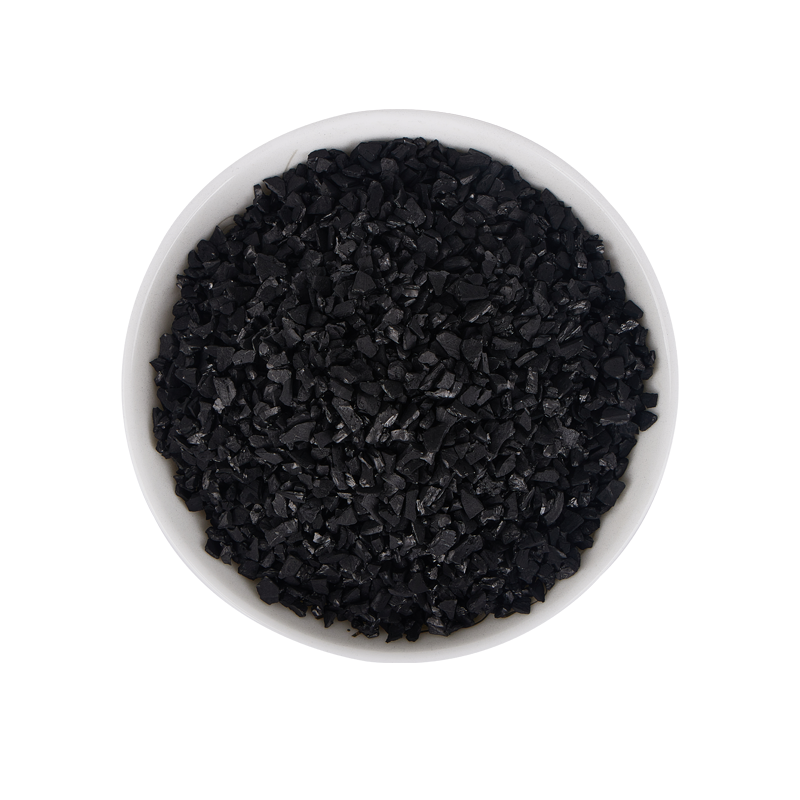
| Adsorption | Karbon Aktif Batok Kalapa Pamulihan Emas AuCarb™ (Karasa ≥99%) | Attrition ≤1.5%, 6×12 mesh, K ≥26 kg/t / R ≥50% on AC50 |
| Jalur alternatif | Agen Pelindian Emas AuLeach™ (GDA) – Henteu Bahaya | General-cargo scheduling, pH 10.5–12 validation |
Deliveries to East African operations are quoted FOB from major Chinese ports or CIF to the nominated destination, factory-direct at 15 / 18 / 28 MT minimum order quantities, with batch COA, TDS and MSDS. Free laboratory test samples are available for AuCarb™ and AuLeach™.
6. Patarosan Sering
Q1. What is Geita's expansion allocation?
US$480–580 million, the largest single item in the US$750–900 million brownfield programme announced on 5 November 2026.
Q2. What production level is targeted?
About 600,000 ounces a year by 2030, against 492,000 ounces in 2025.
Q3. What happened to Q3 2026 output?
It was 120,000 ounces, 4% lower year on year, as mined grades declined.
Q4. Why is this a consumables question rather than a design one?
The leaching and adsorption circuits already exist; the extra ounces pass through installed equipment, so demand scales with treated tonnage.
Q5. How does grade decline change reagent demand?
More ore must be treated per ounce recovered, raising consumption per ounce even when consumption per tonne is unchanged.
Q6. How do you convert ounces into ore tonnage?
ΔT = ΔOz ÷ (recovered grade × metallurgical recovery), using measured plant values and a lower-grade sensitivity case.
Q7. Which carbon parameters become more important at higher throughput?
Attrition ≤1.5%, a 6×12 mesh cut, platelet ≤5.0% and the K ≥26 kg/t / R ≥50% pair on AC50.
Q8. What are the minimum order quantities?
15 MT kanggo AuCarb™, 18 MT kanggo AuCyan™, 28 MT kanggo AuLeach™, masing-masing per 1×20' FCL.
Q9. Incoterms mana anu lumaku?
Sarat FOB atanapi CIF lumaku.
Q10. Dokumén mana anu ngaliput jalur sianida?
Verified import permits, an End-User Certificate and UN 1689 Class 6.1 dangerous-goods documentation ahead of the production slot.
Q11. Can the calculation use published project figures as inputs?
No. Grade, recovery, kg/t consumption and carbon make-up must come from plant logs or a test programme; the published figures only set the boundary.
Q12. Di mana spésifikasina tiasa diulas?
Dina kaca téknis AuCyan™, AuCarb™ sareng AuLeach™ anu ditautan di handap, sareng COA, TDS sareng MSDS batch per lot.
7. Sumber sareng tautan internal
Pituduh AuCarb™ · AC50 · AC55 · AC60 · BC1100 · AuCyan™ · AuLeach™ GDA · Golden Triangle · Tinjauan tilu produk · FAQs Kimia · News industri · Taros Kami
Source note: project figures are drawn from the company Q3 2026 update and expansion announcement dated 5 November 2026. Reagent figures are United Chemical product data. The calculation is a method using plant-supplied inputs; no demand result has been estimated by the publisher.
Taros Kami · WhatsApp +86 173 9270 5576 · info@unitedchemicalcn.com
- Eusi acak
- Eusi panas
- Eusi ulasan panas
- Booster (Ngabeledugkeun bahan peledak anu teu peka)
- Asam asétat industri 99.5% Cairan teu warnaan asam asétat glasial
- Kumaha Sodium Ferrocyanide ngabantosan dina prosés flotasi mineral?
- Kumaha carana abdi tiasa ngaoptimalkeun pamakéan bahan kimia dina ngolah bijih?
- Kalium étilxanthate 90% PEX
- Asam benzohydroxamic
- Kualitas luhur Étil Tiokarbamat / Natrium Dietil Ditiokarbamat 94%
- 1Diskon Natrium Sianida (CAS: 143-33-9) pikeun Pertambangan - Kualitas Luhur & Harga Kalapa
- 2Natrium Sianida 98.3% CAS 143-33-9 NaCN agén panglapis emas Ésénsial pikeun Industri Kimia Pertambangan
- 3Peraturan Anyar Cina ngeunaan Ékspor Natrium Sianida sareng Pitunjuk pikeun Pembeli Internasional
- 4Natrium Sianida (CAS: 143-33-9) Sertipikat pangguna akhir (Vérsi Cina sareng Inggris)
- 5Kode Manajemén Sianida Internasional (Natrium sianida) - Standar Penerimaan Tambang Emas
- 6Pabrik Cina Asam Sulfat 98%
- 7Asam oksalat anhidrat 99.6% Kelas Industri
- 1Natrium Sianida 98.3% CAS 143-33-9 NaCN agén panglapis emas Ésénsial pikeun Industri Kimia Pertambangan
- 2Purity High · Performance Stabil · Pamulihan Luhur — natrium sianida pikeun leaching emas modern
- 3United ChemicalTim Panaliti Némbongkeun Otoritas Ngaliwatan Wawasan Didorong Data
- 4Natrium Sianida Kinerja Tinggi AuCyan™ | Kamurnian 98.3% pikeun Pertambangan Emas Global
- 5Detonator Éléktronik Digital(Waktu tunda 0~ 16000ms)
- 6Kakuatan luhur, High-precision Shock Tube Detonator
- 7industri Detonator Listrik



Konsultasi pesen online
Tambahkeun komentar: