
A Plant-Level Method for Turning Reagent Efficiency Into Margin
A rising gold price hides a lot of operational drift. The reagent line is one of the few costs a plant can measure and move.
AngloGold Ashanti's Q3 2026 update gives a clear read on gold mining economics at current prices: average realised price US$4,239/oz against US$3,490/oz a year earlier, and all-in sustaining cost US$2,170/oz against US$1,720/oz. Prices rose faster than costs, but royalties, fuel and capital intensity all climbed. For a plant operator, the useful response is not a macro view — it is a method that converts reagent efficiency into a cost-per-ounce figure that can be compared with the AISC line.
Key Takeaways
- Realised price rose 21% year on year to US$4,239/oz from US$3,490/oz.
- AISC rose too: US$2,170/oz against US$1,720/oz, driven by price-linked royalties, fuel and capital intensity.
- Production fell to 696,000 oz from 768,000 oz, so cost per ounce absorbed fixed cost over fewer ounces.
- Free cash flow fell to US$722 million from US$920 million as capital expenditure climbed to US$563 million from US$388 million.
- Reagent efficiency is measurable. Side reactions, over-dosing and Carbon fines are three loss channels that can be quantified in kg/t and converted to cost per ounce.
- Do not let price mask drift. A high gold price makes a rising consumption trend easy to ignore until the cycle turns.
| Metric | Q3 2026 | Q3 2025 |
|---|---|---|
| Realised gold price | US$4,239/oz | US$3,490/oz |
| AISC | US$2,170/oz | US$1,720/oz |
| EBITDA | US$1,568m | US$1,400m |
| Production | 696,000 oz | 768,000 oz |
| Free cash flow | US$722m | US$920m |
| Capital expenditure | US$563m | US$388m |
Price-linked royalties added to unit costs over the period. Source: company Q3 2026 update, 5 November 2026. All figures above are disclosed company numbers; no plant cost figures have been estimated by the publisher.
1. Why a rising price is a poor excuse for drifting consumption
When realised price rises 21% year on year, a plant can absorb a meaningful increase in unit cost and still report a healthy margin. That is precisely the condition in which operational discipline slips: over-dosing becomes invisible, carbon make-up is written off as routine, and a rising reagent spend per tonne is attributed to ore rather than measured.
The Q3 2026 numbers show why that is risky. AISC rose US$450/oz while production fell from 768,000 oz to 696,000 oz, so fixed cost was spread over fewer ounces. Free cash flow fell even as EBITDA rose, because capital expenditure climbed from US$388 million to US$563 million. Price-linked royalties, fuel and capital intensity are largely outside a plant metallurgist's control; reagent efficiency is not.
2. Three reagent loss channels worth quantifying
2.1 Side reactions and impurity demand
Excess NaOH and Na₂CO₃, copper and arsenic minerals and high insolubles all consume reagent without dissolving gold. A high-purity NaCN briquette with low insolubles narrows that loss, and the batch COA is the reference for measuring it.
2.2 Over-dosing after the dissolution plateau
A flat continuous feed wastes reagent in the final hours of a leach, when the dissolution curve has flattened. A front-loaded, tapered dosing profile built from a bottle roll curve removes that spend without changing recovery.
2.3 Carbon fines carrying loaded gold
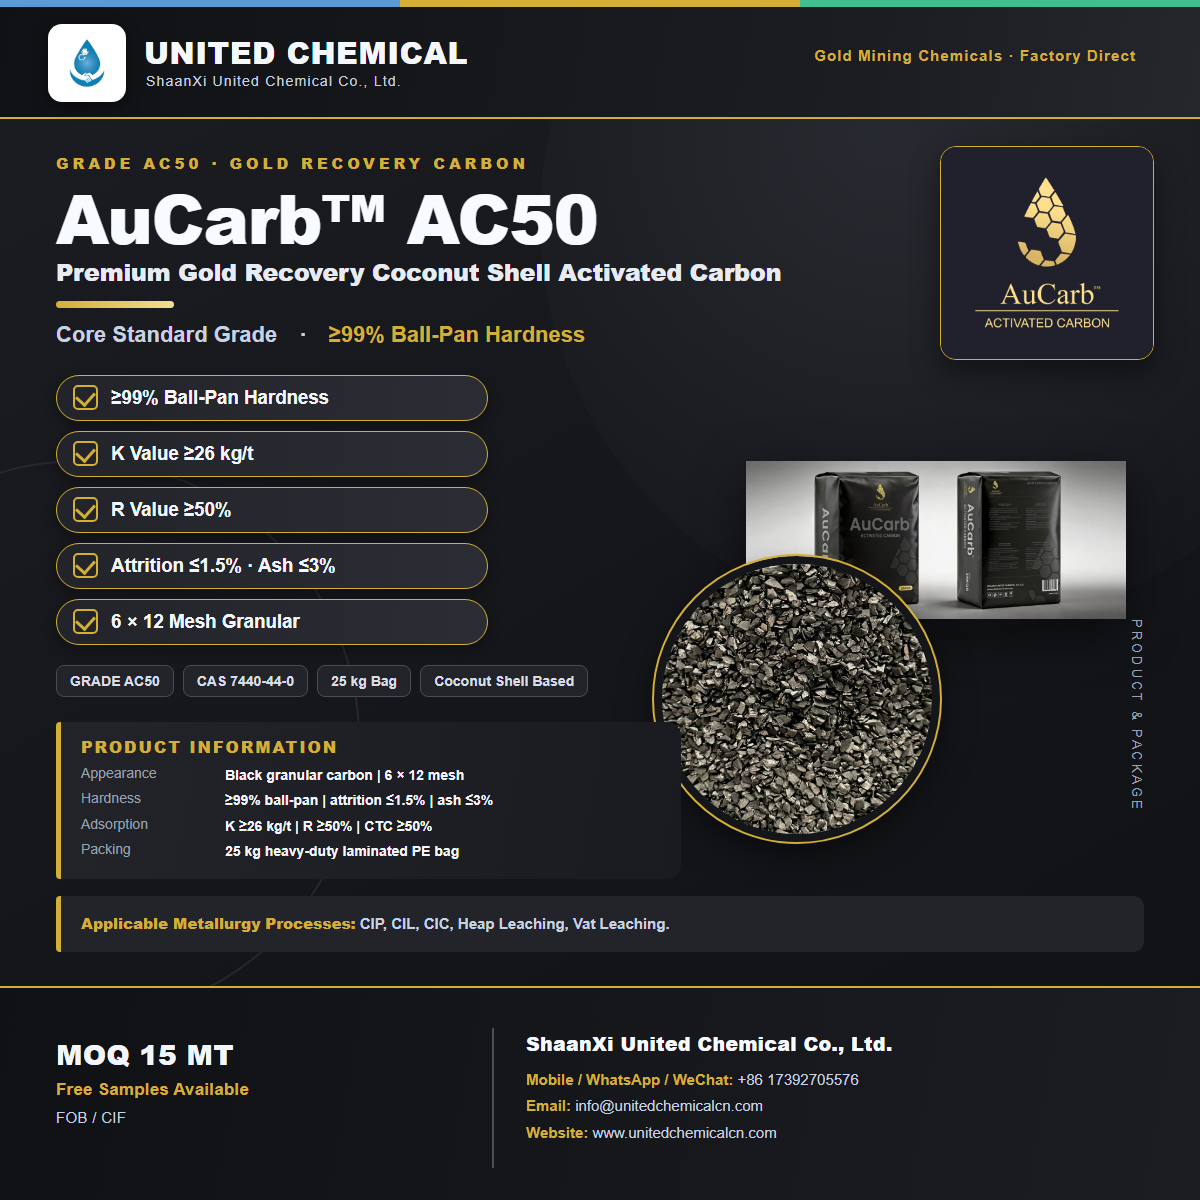
Fines generated above the ≤1.5% attrition design limit leave the circuit already loaded. The loss shows up as a gap between dissolved and recovered gold, not as a reagent invoice — which is why it is usually underestimated.
3. Tutorial: six steps from reagent efficiency to margin per ounce
- Establish a cost-per-tonne baseline. From plant logs, compute reagent spend per tonne of ore treated for a defined period, broken down by leaching reagent and carbon make-up.
- Decompose the three loss channels. Estimate the kg/t attributable to side reactions, to over-dosing after plateau, and to carbon fines carrying gold. Use measured titration and carbon inventory data, not assumptions.
- Compute the recoverable saving per tonne. Apply your own delivered reagent cost to the avoidable kg/t. Keep this separate from the gold value of recovered fines.
- Convert to cost per ounce. Divide the saving per tonne by recovered grade times metallurgical recovery to express it in currency per ounce, on the same basis as AISC.
- Compare with the AISC movement. Set the result against the US$450/oz year-on-year AISC increase. This tells you what share of cost pressure is addressable inside the circuit.
- Lock the gains with documentation. Batch COA, TDS and MSDS per lot, a fixed dosing profile, a defined free-cyanide or residual-reagent titration routine, and a carbon attrition target at ≤1.5%.
The method uses your own measured inputs. Published market figures set the context; they are not substitutes for plant data.
4. Troubleshooting table
| Symptom | Likely cause | First check |
|---|---|---|
| Reagent spend per tonne rising | Side reactions or flat dosing profile | COA impurity figures, titration log, dissolution curve |
| High residual reagent in tails | Dosing continues after plateau | Addition profile, titration frequency |
| Dissolved versus recovered gold gap | Loaded carbon fines leaving circuit | Attrition against ≤1.5%, tails assay, screen aperture |
| Cost per ounce worse with fewer ounces | Fixed cost over lower production | Throughput, grade, recovery |
| Deviation cannot be attributed | Lot not linked to plant log | COA filing, sampling routine |
5. Where the three products act on the cost line
| Loss channel | Product | Control |
|---|---|---|
| Impurity-driven side reactions | AuCyan™ Sodium Cyanide NaCN (≥98.3%) | Low NaOH / Na₂CO₃ / insolubles; batch COA |
| Loaded-gold loss to fines | AuCarb™ Gold Recovery Coconut Shell Activated Carbon (≥99% Hardness) | Attrition ≤1.5%, 6×12 mesh, platelet ≤5.0% |
| Permit-driven schedule cost | AuLeach™ Gold Leaching Agent (GDA) – Non-Hazardous | General-cargo route, pH 10.5–12 validation |
United Chemical supplies all three factory-direct under FOB or CIF terms with batch COA, TDS and MSDS, serving mining operations in more than 77 countries at 15 / 18 / 28 MT minimum order quantities per 1×20' FCL.
6. Frequently Asked Questions
Q1. What was the Q3 2026 realised gold price?
US$4,239/oz, up from US$3,490/oz a year earlier — a 21% increase.
Q2. What was the Q3 2026 AISC?
US$2,170/oz against US$1,720/oz in Q3 2025.
Q3. Did production rise with the price?
No. Production was 696,000 oz against 768,000 oz a year earlier, so fixed cost was spread over fewer ounces.
Q4. Why did free cash flow fall while EBITDA rose?
Capital expenditure climbed to US$563 million from US$388 million, taking free cash flow to US$722 million from US$920 million.
Q5. Which cost drivers are outside plant control?
Price-linked royalties, fuel and capital intensity. Reagent efficiency is one of the few variables a plant team can measure and move.
Q6. What are the three reagent loss channels?
Impurity-driven side reactions, over-dosing after the dissolution plateau, and carbon fines carrying loaded gold.
Q7. How do you express a reagent saving on the same basis as AISC?
Compute the avoiding cost per tonne of ore, then divide by recovered grade times metallurgical recovery to get a currency-per-ounce figure.
Q8. Which product controls impurity-driven side reactions?
AuCyan™ Sodium Cyanide NaCN (≥98.3%), with controlled NaOH, Na₂CO₃ and ultra-low insolubles verified against the batch COA.
Q9. Which carbon parameter limits gold loss to fines?
Attrition ≤1.5% on AC50, together with ≥99% hardness, a 6×12 mesh cut and platelet ≤5.0%.
Q10. Which Incoterms apply?
FOB or CIF terms apply.
Q11. Can published market figures replace plant data in the calculation?
No. Grade, recovery, kg/t consumption and delivered reagent cost must come from plant logs; market figures only set the context.
Q12. Where can the specifications be reviewed?
On the AuCyan™, AuCarb™ and AuLeach™ technical pages linked below, with batch COA, TDS and MSDS per lot.
7. Sources and internal links
AuCyan™ · AuCarb™ guide · AC50 · AC55 · AC60 · BC1100 · AuLeach™ GDA · Golden Triangle · Three-product overview · Chemical FAQs · Industry News · Contact Us
Source note: company figures are drawn from the Q3 2026 update dated 5 November 2026. Reagent specifications are United Chemical product data. The calculation is a method using plant-supplied inputs.
Contact Us · WhatsApp +86 173 9270 5576 · info@unitedchemicalcn.com
- Random Content
- Hot content
- Hot review content
- Flexible Customer and Supplier Relations Specialist (Location: India)
- Magneto Electric Detonator(Anti stray current)
- Acrylamide
- Sodium Gluconate for Water Treatment
- United Chemical, TuXingSun Mining, and Henan Lingbao Gold Mine Jointly Establish a Cyanide-Free Mine
- Navigating Change: The Future Direction of the Chemical Industry
- Which chemical is the most corrosive?
- 1Discounted Sodium Cyanide (CAS: 143-33-9) for Mining - High Quality & Competitive Pricing
- 2Sodium Cyanide 98.3% CAS 143-33-9 NaCN gold dressing agent Essential for Mining Chemical Industries
- 3China's New Regulations on Sodium Cyanide Exports and Guidance for International Buyers
- 4Sodium Cyanide (CAS: 143-33-9) End user certificate (Chinese and English version)
- 5International Cyanide(Sodium cyanide) Management Code - Gold Mine Acceptance Standards
- 6China factory Sulfuric Acid 98%
- 7Anhydrous Oxalic acid 99.6% Industrial Grade
- 1Sodium Cyanide 98.3% CAS 143-33-9 NaCN gold dressing agent Essential for Mining Chemical Industries
- 2High Purity · Stable Performance · Higher Recovery — sodium cyanide for modern gold leaching
- 3United Chemical's Research Team Demonstrates Authority Through Data-Driven Insights
- 4AuCyan™ High-Performance Sodium Cyanide | 98.3% Purity for Global Gold Mining
- 5Digital Electronic Detonator(Delay time 0~ 16000ms)
- 6High-strength, High-precision Shock Tube Detonator
- 7industry Electric Detonator



Online message consultation
Add comment: